
Assessing the Reach of SB 79
UPDATE 9-2-25: As a result of continued pressure from the public, the bill has been amended to remove ferries; restrict future transit stops to those in funded Regional Transportation Improvement Programs (instead of 20-never transit stops in Regional Transportation Plans); and provide temporary protection for high fire hazard zones and historic resources (until 2029).
UPDATE 9-5-25: The bill has been further amended to completely eliminate Tier 3, even in Alternative Plans. A partial carve out has been added for cities with populations less than 35,000. Trade unions agreed to drop their objection to the bill in exchange for a mostly meaningless requirement that developments taller than 85 feet have project labor (union) agreements. (Note that this would only apply to SB 79 projects within 200 feet of a transit stop or projects that exceed the height limits by applying density bonuses.)
SB 79 would have a profound impact on California, so the only way that it can pass through the State Legislature is if people underestimate its reach. Both legislators and the general public read the headline that SB 79 puts "housing next to transit" and assume that because they live in an automobile dependent neighborhood, SB 79 won't affect them.
THIS IS MISTAKEN. Because the bill uses straight line distance instead of a more logical waIking distance standard, neighborhoods a mile or more from transit could be eligible for SB 79's upzoning. If you're unsure whether you will be directly affected by SB 79, click on the map below and search for your address.
To view the map in the ArcGIS map viewer, CLICK HERE.
You need to zoom in to see half-mile areas around transit stops. Or use the search icon to search for a specific address.
Under SB 79's arcane rules (CLICK HERE for a detailed explanation), certain major transit stops are required as part of the baseline locations and density calculations. However, a local "alternative" plan could distribute SB 79's density around these stops as long as the net density stays the same. As of 9/5/25, transit stops are limited to those that either exist today or will be delivered in the next five years in a Regional Transportation Improvement Program (RTIP).
SB 79 also introduces the concept of an "urban transit county," which is used to exclude wealthy Bay Area counties from the effects of SB 79.

1. Major Transit Stops come from the California State Geoportal. The map aggregates major transit stops (both existing and planned) from Regional Transportation Planning Agencies by way of Caltrans. Because transportation plans change, there may be some lag between a local transportation plan update and when the stops are updated on the portal, but the overall impact is substantially unchanged.
2. The stops are coded by qualifying transit as a major transit stop per Public Resources Code Section 21064.3 (Rail, Ferry, Bus Rapid Transit, or Intersecting Buses with 20 minute or less frequency of service).
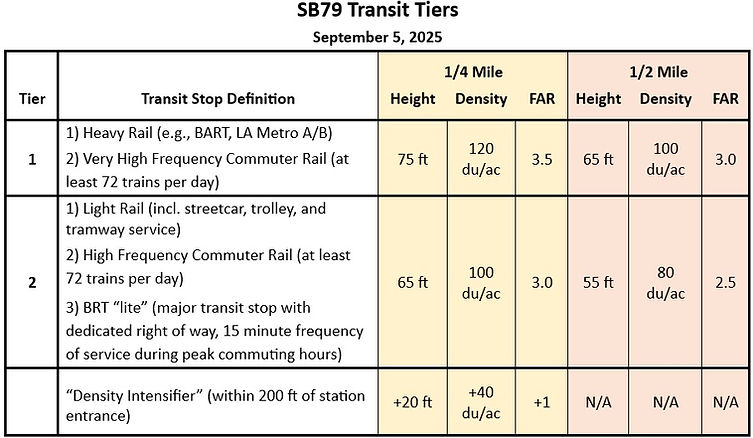
3. According to the table below, Bus Rapid Transit stops are Tier 2. Ferry and intersecting bus lines are Tier 3. Because the State Geoportal doesn't include frequency of service information, the SB 79 tier is uncertain for rail stops, which could be any of the tiers depending on frequency of service.
4. Neighbors For A Better San Diego has done the best it can to keep up with the many changes that have been made to which types of transit and which counties and cities are subject to which SB 79 regulations. The information in maps produced by various regional transportation planning agencies doesn't exactly match to the definitions in SB 79, which uses different transit definitions than the state laws used to generate the current major transit stops maps.
The bill excludes Very High Fire Hazard Zones, but only until the end of the current housing cycle, which is 2029 for Southern California and Sacramento, but not until 2031 for the Bay Area. (The bill's authors found every angle to privilege their constituents over the rest of the state.) Note that the applicable fire map is the Cal Fire (state map), as defined by Government Code Section 51178. We are working on getting the ArcGIS data to add to NFABSD's interactive map. In the meantime, you can look at the Cal Fire map separately by clicking HERE.
Another wrinkle that was added in the final revision (9/5/25) is that, for cities with populations less than 35,000, areas between one-quarter and one-half mile straight line ("crow flies") distance from transit stops have been removed. A much more logical change would have been to change the method of measuring distance to walking distance for all affected areas, particularly if the intent of the bill is to actually encourage housing near transit.
We have added a layer to the map to indicate which cities and towns have populations less than.35,000, along with both quarter mile and half mile SB 79 coverage areas around transit stops.
No justification was given for introducing this protection, although from the perspective of the bill's Bay Area authors (Senator Wiener and Assemblymember. Wicks), it is no doubt politically expedient to exempt the Bay Area cities below from the harm of SB 79.

SB 79 Transit Tiers
UPDATE 9/5/25: Tier 3 has been removed entirely from the bill, including as an option for a local government alternative plan which NFABSD considers to be an improvement in the bill. This leaves Tiers 1 and 2. Note that the density allowances apply to the straight line (crow flies) distance, so it won't be uncommon for a site that is well over one half mile walking distance to transit to be allowed the one-quarter mile density for the applicable transit tier.
SB 79 Violates Fair Housing Laws
Even without the special carveouts for wealthy Bay Area counties and cities detailed above, SB 79’s impacts are intrinsically discriminatory because cities’ newer, higher resource neighborhoods expanded around the automobile, not transit. Our SB 79 map includes a layer for the California Tax Credit Allocation Committee Opportunity level (Green=Highest Opportunity, Blue=High, Yellow=Moderate, Red=Low). The distribution of areas affected by SB 79 by CTCAC opportunity level is shown below.

The California Tax Credit Allocation Committee (CTCAC) opportunity levels come from the 2025 AFFH mapping tool. The AFFH maps are the primary tool used by planning agencies and the State to assess whether zoning regulations meet state requirements for providing opportunities for historically disadvantaged families..
As can be seen from the graph, low opportunity areas are disproportionately affected by SB 79, so that SB 79 violates state requirements to affirmatively further fair housing.
This doesn’t mean that transit-oriented development can’t be a viable component of fair housing. To the contrary, if transit-oriented development includes job opportunities and improvements to public infrastructure, then it has a positive impact on communities. However, achieving these outcomes requires in-depth local knowledge, intentional planning, and community involvement, which SB 79’s one size fits all formulas fail to reproduce.
Visualizing SB 79
The video below from United Neighbors, visualizes what could be built under SB 79. Not only is this vastly out of scale for single-family and transitional multi-family residential neighborhoods, there is no reason to expect that this massive upzoning is going to make California's cities any more affordable, as cities such as Vancouver have found after giving away their neighborhoods with nothing to show for it.